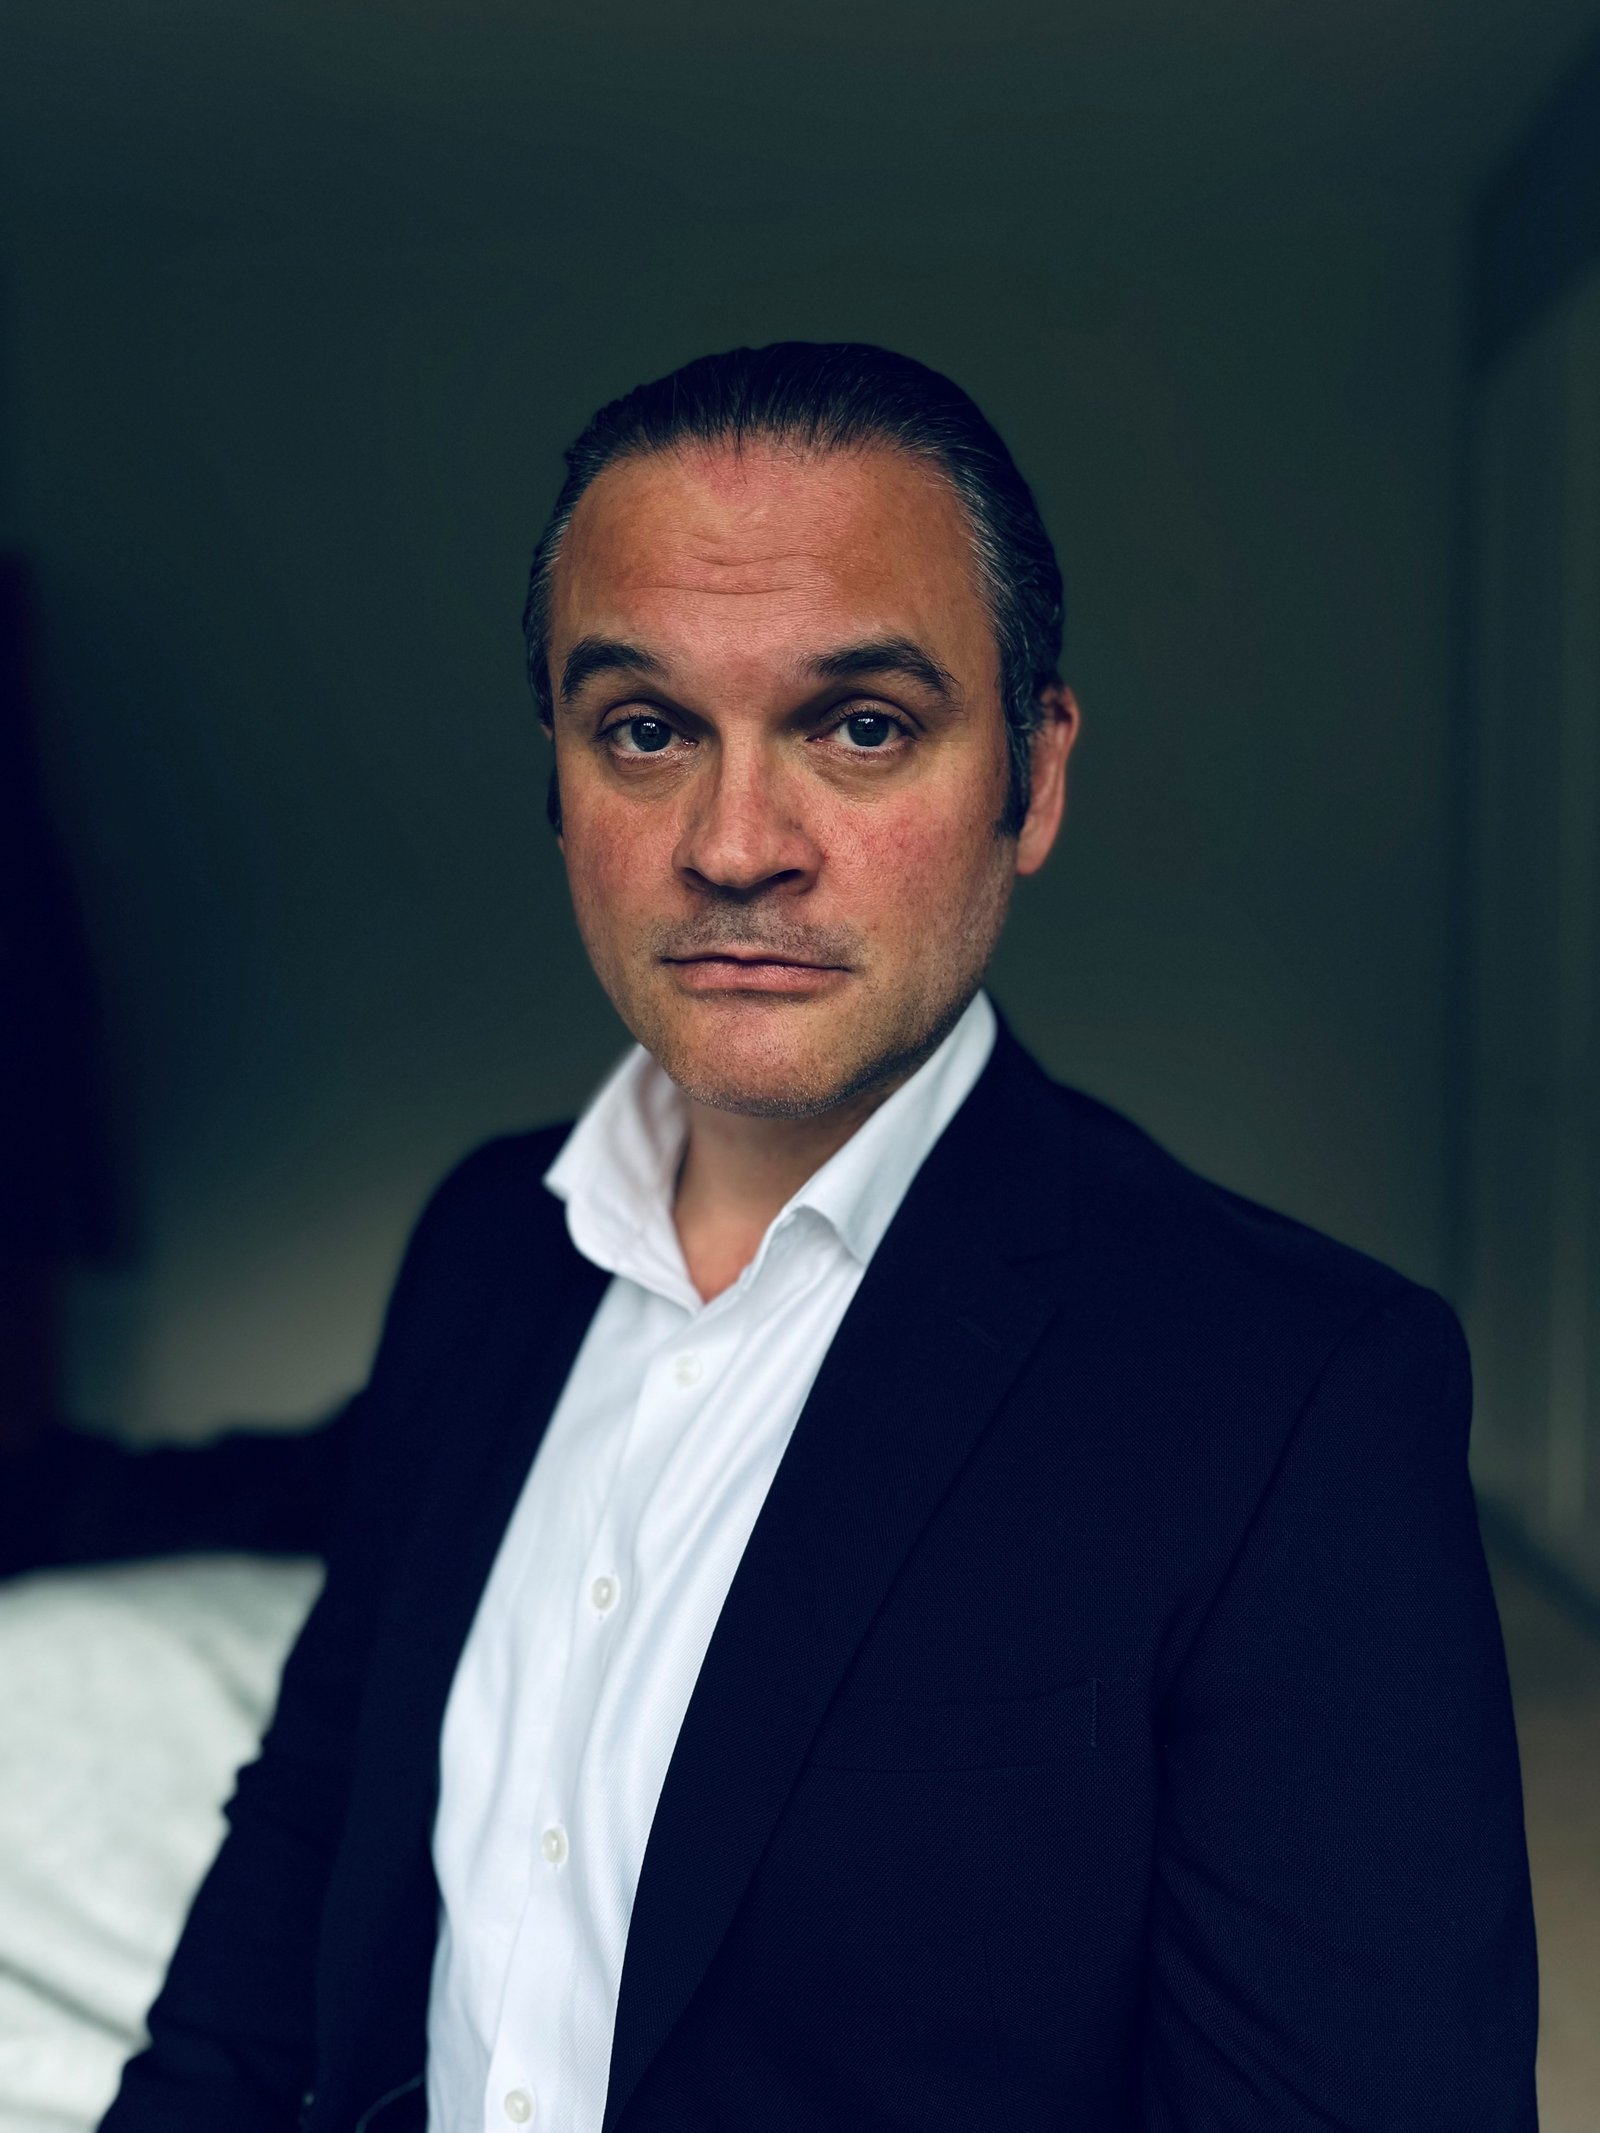
Every Inefficiency.
Found. Quantified. Eliminated.

The Full FLOW Audit is the most comprehensive operational engagement available to UK SMEs. 72 checkpoints. Four pillars. Four weeks. Minimum £20,000 savings — or it's free.

72 checkpoints
4-week engagement
On-site visit included
£20,000+ savings guaranteed
The Guarantee

In a business turning over £500k+, finding £20,000 of operational waste is the floor, not the ceiling — which is why we can put the entire fee at risk against it.

If we do not identify a minimum of
£20,000 in annual savings
the audit is entirely free.

No partial fees. No kill fee. Nothing.

The Waste Is Already There. You Just Can't See It.

If your business is turning over £500k and losing even 8% to operational waste, that's £40,000 a year. Every year you don't find it, you lose it again. Most owners know the number is significant. They just don't know where it's hiding.

It compounds invisibly. Staff turnover you're replacing at 30% of salary cost and accepting as normal. Enquiries you're losing because your response time is 48 hours, not 5 minutes. Debtor days running at 45 when your terms say 30 — that's a six-figure cash flow gap at volume. Supplier invoices nobody's questioned in two years. Equipment sitting idle at 60% utilisation while you're turning away work.

The Full FLOW Audit finds all of it. Every one. Across all 72 checkpoints. In four weeks.

How the Pricing Works

Our fee is 20% of the total annual savings we identify. If we identify £60,000 in savings, our fee is £12,000. If we identify £40,000, our fee is £8,000. If we identify less than £20,000 — the audit is entirely free.

Savings Identified Fee
£25,000£5,000
£40,000£8,000
£60,000£12,000
£80,000£16,000
£100,000£20,000

Our incentive is entirely aligned with your outcome. We only earn more if we find more. There is no incentive to inflate findings — only to find everything. If we find £60,000, we earn £12,000. If we find nothing, you pay nothing.

How the fee is calculated

  • 1.We identify every saving across all 72 checkpoints, documenting evidence and basis for each figure.
  • 2.Every saving is expressed as an annual figure. Where a saving recurs (e.g. reduced staff turnover cost), the year-one saving is used.
  • 3.The total is the sum of all identified annual savings. Our fee is 20% of that total.
  • 4.The fee figure is presented alongside the full audit report at the final presentation call, with every line item supporting it.
  • 5.If identified savings total less than £20,000, the entire engagement is free — no invoice is raised.
  • 6."Identified savings" means savings our analysis shows are available to your business — not savings already realised. Implementation is your decision. The fee is based on what we find, not what you act on.

Everything Included — Before the Pricing Model Applies

The full value of the engagement before a single saving has been quantified.

Deliverable Standalone Value
Full onboarding and data collection across all 72 checkpoints£500
One mandatory half-day on-site visit£800
Four weekly progress check-in calls (30 minutes each)£600
Consultant email access throughout the 4-week engagement£400
Final 72-point audit report — every finding, every saving quantified£2,000
Boardroom-ready executive summary (one page)£300
Full 90-day implementation roadmap — sequenced by impact and effort£800
3 sector-specific SOP templates£600
KPI dashboard specification — the 10–12 numbers the owner tracks weekly£500
90-minute final presentation call£400
30-day post-delivery email support£300
Total standalone value£7,200
Your investment20% of identified savings

If your business is turning over £500k and losing even 8% to operational waste — that's £40,000 a year. Every year you don't find it, you lose it again. The audit pays for itself from the first month of implementation.

The Four FLOW Pillars

Every engagement examines the complete operational cycle. Four pillars. Every one scored. Every finding quantified.

F

FIND — Lead Generation & Conversion

How effectively you attract, capture and convert enquiries into paying customers. This pillar examines every step from first contact to confirmed job — and quantifies what you're losing at each one.

  • Lead generation channels and whether all are tracked
  • Website conversion basics — CTA, contact form, response mechanism
  • Google Business Profile completeness and review volume
  • Average lead response time vs the 5-minute benchmark (21x qualification uplift)
  • Quote-to-conversion rate vs sector benchmark
  • Whether a follow-up process exists after quotes are sent
  • Pricing strategy — cost-plus vs value-based
  • Upselling and cross-selling at point of sale
  • Enquiry qualification process and lost opportunity cost calculation
L

LOAD — Scheduling & Resource Allocation

How efficiently you plan and allocate your capacity. This pillar examines whether work is flowing through your operation at maximum throughput — or leaking out through poor scheduling, travel inefficiency and reactive management.

  • Scheduling system effectiveness and tools in use
  • Utilisation rate of staff and assets vs productive capacity
  • Whether capacity is planned forward or managed reactively
  • Travel and logistics optimisation — route efficiency and dead time
  • Job preparation standardisation — briefing, materials, pre-works
  • Frequency of delays, overruns and reschedules
  • Whether a formal daily or weekly operational rhythm exists
  • Capacity planning process — peaks, troughs and cover arrangements
  • Key man dependency risk — single points of failure in delivery
O

OUTPUT — Delivery, Quality & Completion

How well your operation executes and delivers. This pillar examines whether work is completed right first time, on time, to standard — and where quality failures are costing you money in rework, callbacks and reputation damage.

  • First-time fix or first-time completion rate
  • Callback and rework rate and cost
  • Complaint rate vs sector benchmark
  • Refund and credit rate
  • Google review volume, rating and trend vs competitors
  • Whether formal quality checks occur at point of delivery
  • Whether a formal complaint handling process exists
  • Variation and scope creep management
  • Customer satisfaction measurement — NPS or equivalent
W

WEALTH — Cash Flow & Margin Protection

How effectively you convert completed work into cash and protect your margin. This pillar examines the full financial cycle from invoicing through collection — and identifies where money is leaking out of a business that looks profitable on paper.

  • Invoice-to-payment timeline and debtor days vs terms offered
  • Whether a formal credit control process exists
  • Cash flow gap calculation — the £ cost of late payment
  • Bad debt written off in the last 12 months
  • Supplier and cost management — renegotiation frequency
  • Fixed cost review — subscriptions, contracts and overheads
  • Gross and net margin vs sector benchmarks
  • Overhead as a percentage of revenue
  • Whether deposits or staged payments are used to protect cash flow

All 72 Checkpoints

Every checkpoint is scored, every relevant finding is quantified in £, and every gap generates a recommendation in the final report.

F

FIND — Lead Generation & Conversion

Checkpoints 1–18
  • F1How enquiries currently arrive and whether all channels are tracked
  • F2Website CTA clarity, contact form function and response mechanism
  • F3Google Business Profile completeness, category, photos and description
  • F4Google review volume and star rating vs top 3 local competitors
  • F5Average lead response time vs the 5-minute benchmark
  • F6Mystery shopper enquiry test — speed, professionalism, follow-up
  • F7Whether a CRM or lead tracking system is in use
  • F8Estimated annual revenue lost to slow or missed enquiry response
  • F9Quote-to-conversion rate vs sector benchmark
  • F10Whether a formal follow-up process exists after quotes are sent
  • F11Average time from enquiry to quote issued
  • F12Quote presentation quality — written, branded, clear pricing
  • F13Whether upselling or cross-selling occurs at point of sale
  • F14Pricing strategy — cost-plus vs value-based
  • F15Annual revenue leakage from below-benchmark conversion rate
  • F16Social media presence and consistency across platforms
  • F17Referral and repeat business rate and whether it is actively managed
  • F18Lead source attribution — which channels produce the best ROI
L

LOAD — Scheduling & Resource Allocation

Checkpoints 19–36
  • L1Scheduling system in use — digital, paper, ad hoc
  • L2Whether capacity is planned forward or managed reactively
  • L3Staff utilisation rate vs billable or productive capacity target
  • L4Asset and equipment utilisation rate
  • L5Travel and logistics efficiency — route planning, dead mileage, travel time ratio
  • L6Whether jobs are briefed and prepared before execution
  • L7Materials, consumables or van stock management
  • L8Frequency of delays, overruns and reschedules — and root causes
  • L9Whether a formal daily or weekly operational rhythm exists
  • L10Estimated cost of operational inefficiency based on utilisation gap
  • L11Key man dependency — whether the business halts without specific individuals
  • L12Cover arrangements — what happens when key people are absent
  • L13Subcontractor or temporary labour management and cost
  • L14Whether workload is seasonally planned or handled reactively
  • L15Job costing — whether actual cost is measured against estimate
  • L16Whether minimum lead times and capacity ceilings are defined
  • L17Communication flow between office, field and customer during delivery
  • L18Whether turnaround time targets exist and are tracked
O

OUTPUT — Delivery, Quality & Completion

Checkpoints 37–54
  • O1First-time fix or first-time completion rate
  • O2Callback, return visit and rework rate and quantified cost
  • O3Customer complaint rate vs sector benchmark
  • O4Refund, credit and discount rate — frequency and total annual cost
  • O5Google review rating and trend vs local competitors
  • O6Trustpilot or sector-specific review platform presence
  • O7Whether formal quality checks occur at point of delivery
  • O8Whether a formal complaint handling process exists and is followed
  • O9Variation and scope creep management — how changes are captured and priced
  • O10Customer satisfaction measurement — NPS, survey or equivalent
  • O11Estimated annual cost of poor quality — complaints, refunds, rework, reputation
  • O12Whether written standard operating procedures exist for key processes
  • O13Staff training and onboarding process — whether it is standardised
  • O14Staff turnover rate vs sector benchmark and annual replacement cost
  • O15Whether a formal performance review process exists
  • O16Whether staff are cross-trained to provide operational cover
  • O17Legal actions, County Court Judgements or formal disputes in the last 3 years
  • O18Whether customer experience is consistently defined and managed
W

WEALTH — Cash Flow & Margin Protection

Checkpoints 55–72
  • W1Payment terms offered to customers vs terms actually received
  • W2Debtor days calculation and cash flow gap in £
  • W3Whether a formal credit control process exists
  • W4Whether late payment is chased systematically — escalation process
  • W5Whether deposits or staged payments are used
  • W6Bad debt written off in the last 12 months
  • W7Annual cost of late payment quantified
  • W8Gross and net profit margin vs sector benchmarks
  • W9EBITDA margin and trend — improving, static or declining
  • W10Revenue concentration risk — over-reliance on single customers
  • W11Fixed vs variable cost ratio and overhead as a percentage of revenue
  • W12Year-on-year revenue and margin trend from filed accounts
  • W13Whether key suppliers have been reviewed or renegotiated in the last 2 years
  • W14Whether purchasing is centralised or ad hoc
  • W15Fixed cost review — subscriptions, software, contracts and standing orders
  • W16Estimated annual overspend on supplier costs
  • W17Whether relevant licences, certifications and insurance are current
  • W18Companies House filing status — accounts, confirmation statements, director details

What You Receive at the End of the Engagement

Eleven deliverables. Every one produced by a consultant who has been inside your operation for four weeks.

Final 72-Point Audit Report

Every finding documented. Every saving quantified in £. Every gap scored and rated. The definitive view of your operation — in writing.

Boardroom-Ready Executive Summary

One page. Every key finding and the total savings identified. Built for presentations to directors, investors, lenders or prospective buyers.

Full 90-Day Implementation Roadmap

Sequenced by impact and effort. What to do first, what to do next, and what to do last. A clear plan from day one of implementation.

Four Weekly Check-In Calls

30 minutes each, once per week throughout the engagement. You are kept informed at every stage. No surprises at the end.

3 Sector-Specific SOP Templates

Written standard operating procedures for three key processes identified during the audit. Branded and ready to implement on day one.

KPI Dashboard Specification

The 10–12 numbers the owner should be tracking every week. Defined, formatted and handed over ready to implement in whatever system you use.

90-Minute Final Presentation Call

Full walkthrough of findings, savings, the roadmap and your three SOPs. Every question answered. This is the call that changes how you run the business.

Consultant Email Access Throughout

Direct access to your consultant for questions, clarification and context throughout the four-week engagement. Not a support desk — your consultant.

Half-Day On-Site Visit

One mandatory half-day visit during the engagement. For a 72-point comprehensive audit, there are things we can only observe in person. Scheduled in week 2 or 3.

Full Onboarding & Data Collection

Structured data gathering across all 72 checkpoints. Client information form, document review, desk research and the on-site visit all feed into a single, comprehensive dataset.

30-Day Post-Delivery Email Support

Direct email access to your consultant for 30 days after the final report is delivered. Implementation questions, clarifications, sense-checks — all included.

The Full FLOW Audit is built for...

  • Businesses turning over £500k or more that know something is leaking but can't isolate where
  • Businesses with multiple problem areas identified in a Diagnostic Assessment wanting to act on all of them
  • Businesses that have grown rapidly and know their systems haven't kept up with their revenue
  • Businesses under serious margin pressure who want a definitive answer — not a guess
  • Businesses considering acquisition, investment or exit — this report is due diligence grade
  • Businesses that have tried fixing things piecemeal and want the complete picture in one engagement

Five Steps. Four Weeks. One Definitive Report.

From discovery call to final presentation. No surprises.

1

Discovery Call

A 30-minute call to understand your business, confirm fit, agree scope and set the start date. This is the first thing we do before any commitment is made. No sales pressure — if it's not the right product for your situation, we'll tell you.

2

Onboarding — Week 1

Full data collection across all 72 checkpoints. You receive a structured Client Information Form and a document request list. We conduct independent desk research simultaneously — Companies House, Google, sector benchmarks, website analysis.

3

Analysis — Weeks 2 and 3

Remote analysis runs in parallel with the on-site half-day visit, scheduled in week 2 or 3. Four weekly check-in calls keep you informed. Analysis covers all 72 checkpoints — every gap identified, every saving estimated.

4

Report Production — Week 4

Final 72-point audit report produced. Executive summary written. 90-day implementation roadmap sequenced. KPI dashboard specified. Three SOP templates drafted. Everything reviewed internally before delivery.

5

Final Presentation — End of Week 4

90-minute video call presenting the complete findings. Every saving walked through. The roadmap agreed. Questions answered. This is the call that turns the report into a plan. Thirty days of email support begins from this point.

Founding-client results — coming soon

We’re onboarding our first cohort of founding clients now. Verified, named results will appear here as those engagements complete. In the meantime, the guarantee below carries the risk, not you.

Carl Trigg, founder of Flow Efficiency
Who does the work

Carl Trigg

Founder, Flow Efficiency

I'm Carl Trigg, founder of Flow Efficiency. I've spent nearly twenty years finding and fixing operational waste — from defence to automotive, manufacturing to storage, and education to the nuclear sector. The methods that save big companies millions rarely reach smaller businesses, and that's what I'm here to change.

Every Full FLOW Audit is delivered personally. That's also why I take on a limited number of engagements each month — to protect the quality of every single one.

FAQs

We identify the total annual savings available across all 72 checkpoints. Our fee is 20% of that figure. If we identify £60,000 in savings, our fee is £12,000. If we identify £40,000, our fee is £8,000. If we identify less than £20,000, the audit is entirely free. No partial fees, no kill fee, no awkward conversation. The fee is agreed in writing after the discovery call, before any work begins.
Yes. The Full FLOW Audit includes one mandatory half-day on-site visit. For a comprehensive 72-point engagement, there are things we can only observe in person — operational rhythm, team dynamics, physical layout, equipment condition and how processes actually run versus how they are described. The visit is typically scheduled in week 2 or 3 of the engagement and takes approximately four hours at your premises.
The audit is entirely free. No partial fees, no kill fee, no awkward conversation. The guarantee is documented in writing before we start. If the total identified savings fall below £20,000, you receive every deliverable we have produced and you pay nothing. The risk is entirely ours.
Four weeks from kick-off to delivery of the final report and presentation call. The engagement runs from the confirmed start date to the 90-minute final presentation. The 30-day post-delivery email support period begins from the date of the final presentation call.
The engagement includes 30 days of post-delivery email support — direct access to your consultant for questions, clarification and sense-checking as you begin implementation. For ongoing implementation support, we offer specific Focus Services targeting priority areas from the audit — these are listed in your Next Steps section of the report with fixed prices. Any previously purchased Focus Service fees can be credited against the FLOW Audit fee.
Yes. The Full FLOW Audit report is produced to a standard that can support business acquisition due diligence, investor presentations or exit preparation. The report covers all major operational risk areas, quantifies efficiency gaps and provides a forward-looking implementation roadmap — all of which are standard requirements in acquisition and investment due diligence processes. This makes it a strong fit for owners planning a sale, seeking investment, or wanting to present a credible operational picture to a prospective buyer.
What happens next

Every engagement comes with 3 months of Flow OS included free — your KPIs tracked and reviewed monthly so the savings stick.

Learn about Flow OS

Ready to find everything?

If your business is turning over £500k and losing even 8% to operational waste — that's £40,000 a year. Every year you don't find it, you lose it again.

We take on a limited number of Full FLOW Audit engagements each month to protect delivery quality. If you're considering this, the right time to book a discovery call is now.

Book Your Discovery Call →

Or email us directly: info@flowefficiency.co.uk

This product requires a conversation before purchase — no buy button is intentional.